Did you know? More than half of all businesses measure organic traffic to evaluate the success of their content.
If we were to throw this out there, how many of you would believe us? It does sound probable enough.
How many of you would read on, while casting doubt at the statistic? And how many of you would stop and punch this into Google to verify its validity?
If you’re one to throw caution to the wind at unsupported claims with no attribution (i.e. either one of the last two), well done.
Because as Albert Einstein once said:
The important thing is not to stop questioning. Curiosity has its own reason for existence.
As content marketers, our goal is to create attractive and quality content to draw readers in. And many times, we turn to data to help us paint a scene, make a point, and basically support the story we want to tell.
But even though data and content marketing go hand-in-hand, simply citing statistics isn’t enough. The key to data-driven content marketing lies in the way it’s presented.
Simply citing statistics in your content isn’t enough. The key to data-driven content marketing lies in the way it’s presented.Click To TweetIn this post, we’ll dive into the importance of statistics in marketing, how to leverage data sets, and also present you with a list of reliable external data sources you can comb through and use for your content.
Let’s get to it.
Why use statistics in writing?
To start, let’s look at the role of statistics in marketing and what they help content marketers achieve.
1. It paints a clearer picture
Many, most, the majority of…
Quantitative terms like these are common in content writing. And while there’s nothing technically wrong with them, they just don’t paint a sharp enough picture.
These terms are indeterminate and often relative, which means they can be interpreted in multiple ways.
Now, when an actual number is provided, it gives readers a better sense of reality.
Here’s an example.
Based on this statistic by eMarketer, we can say:
More than half of US teens and adults own tablets and/or smartphones.
Mathematically speaking, it’s not a false statement.
But since “more than half” can range from anything from 50.0001% to 100%, it’s not the best choice of words to use to describe smartphones and tablets ownership.
It’s when we dive into the specifics by providing concrete figures that we’re able to understand the penetration rates of these devices:
88% of US teens and adults own smartphones.
51% of US teens and adults own tablets.
Though 88% and 51% do mean “more than half,” the difference between the two figures is so large that citing them both paints a whole different picture than our first statement.
Because quantitative terms are indeterminate and often relative they can be interpreted in multiple ways. When possible, use an actual number to give readers a better sense of reality. Click To Tweet2. It makes you more authoritative
This ties in with the previous point. Having a statistic embedded into your content instead of a sweeping statement backs your authority as a brand.
It shows you bothered to do your research and interpret the data you found. And as mentioned in the previous point, terms like many or the majority of are also vague, whereas a statistic is indisputable.
Citing a statistic that came from a trusted or even internal source also adds extra credibility—but more on this later.
3. It is more actionable
A statistic also provides more actionable opportunities for your readers.
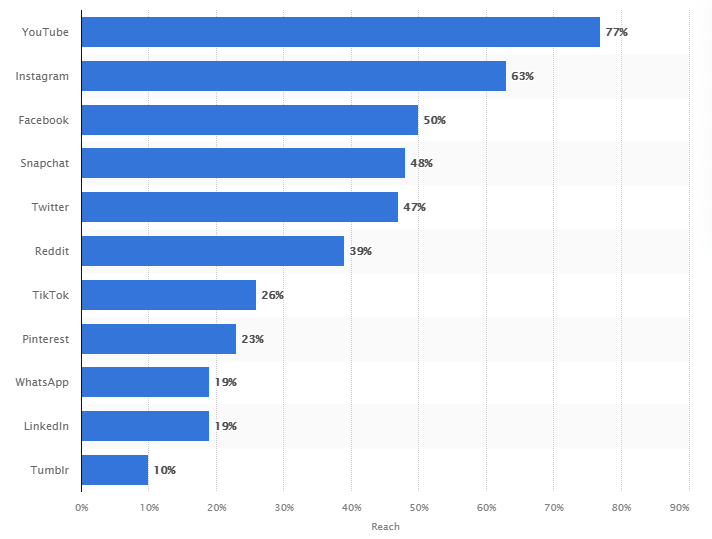
Say your company’s product is a social media tool, and you had this statistic showing the reach of social media sites among US teens and young adults.
If you had clients whose target audience is this exact demographic, these statistics would show them exactly where they need to focus their social media efforts—on YouTube, Instagram, and/or Facebook, instead of LinkedIn or Tumblr.
4. It generates backlinks (extra points for SEO)
Another benefit of using statistics in your content is its potential to generate backlinks, which boosts SEO.
Take, for example, this post on Facebook statistics by Oberlo. It’s got key statistics from the number of users and its age demographics to the average time spent on the platform.
The result? 1,600 backlinks from all over the web, including high authority websites like Investopedia, HubSpot, Neil Patel, and Social Media Today.
Sources of digital data: internal and external
Now that we understand the importance of statistics in content marketing, let’s have a look at the two different types of sources of digital data: internal and external.
What are internal data sources?
An internal data source is essentially your business.
These can be anything from company-led surveys you send out to your clients and/or industry leaders to the feedback you receive from your clients.
Internal data sources are generally rarer to come by because of the amount of work it takes to create, disseminate, and analyse these surveys.
That being said, it’s a great opportunity to create big rock content, which can then be repurposed, remarketed, reformatted, for new marketing opportunities. It’s also a tried-and-tested way to scale your content strategy.
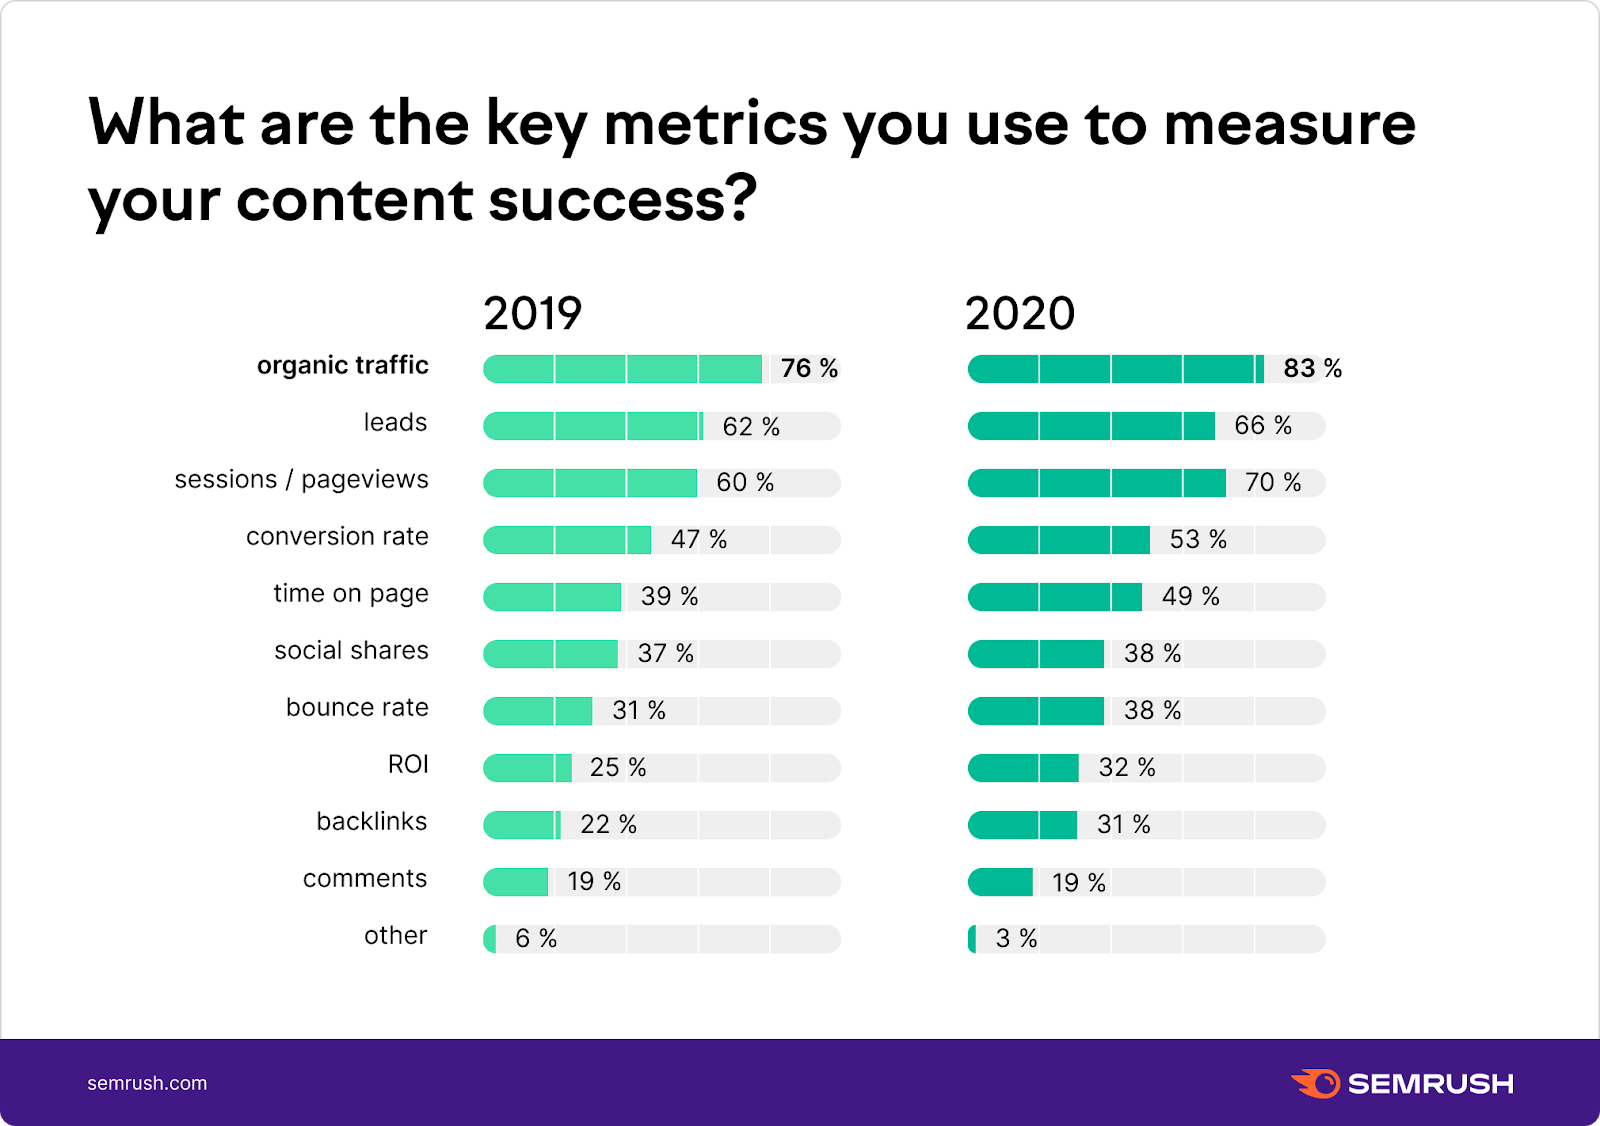
An example of an internal data source is this survey by Semrush on content marketing.
As you can see, they’ve used the results obtained to publish a comprehensive post filled with statistics. They’ve even created corresponding graphs and infographics, which are wonderful for sharing on social media.
(Did you also notice the number of backlinks and referring domains they’ve gotten from this post?)
What are external data sources?
External data sources, as its name suggests, are references that come from outside of your company.
We can break this down further into different categories: market research companies, industry leaders, and public data.
Market research companies
Market research companies do exactly that: market research. Examples include Kantar, Gartner, YouGov, and Statista.
Instead of focusing on one particular sector, they typically cover a wide range of different markets and topics. Statista, for instance, boasts a database of “insights and facts across 170 industries and 150+ countries.”
Market research companies collect their data by conducting qualitative and/or quantitative research, usually through surveys, interviews, or focus groups.
After gathering the data, they sort them out, break them down, analyse them, interpret them, and sometimes also offer their own expert insights and recommendations.
Industry leaders
Industry leaders are companies that are reputable in their fields and are equipped with enough resources, influence, and reach to conduct reliable surveys.
Just like market research companies, they also analyse, interpret, and publish the results of their surveys.
However, industry leaders only do this for topics that fall within their expertise. One example of this would be the content marketing survey by Semrush we mentioned earlier.
Even though the results are published on their blog itself, which, for them, would be an internal data source, they can also be used as an external data source.
For instance, if our team at Dear Content were to do a post on the importance of having a content strategy, we could tap on their survey results as an external data source.
Open data
Last but not least, open data refers to databases from public sources like government departments or intergovernmental organisations.
These include the World Bank, World Health Organisation, United Nations, chambers of commerce, and so on.
These are considered to be official data and are usually large-scale—local, national, or even international, depending on the organisation.
External data sources are references that come from outside of your company, such as market research companies, industry leaders, and public data. Click To TweetThe right way to apply statistics in content marketing
Remember the statistic we threw to you right at the beginning of this article?
More than half of all businesses measure organic traffic to evaluate the success of their content.
With no source credited, no backlink, no numbers, nothing, that’s no way to leverage data in content marketing.
In this section, we’ll show you exactly how you should be citing statistics in your content using this particular statistic as an example.
1. Where possible, use numbers and not words
First and foremost, always use numbers instead of words.
Numbers are more precise and as we’ve seen from the example we gave above, words are vague and leave much room for interpretation.
So, instead of saying:
More than half of businesses measure organic traffic to evaluate the success of their content.
This would work better:
83% of marketers measure organic traffic to evaluate the success of their content.
See how that changes?
There are, however, exceptions.
Sometimes, you may need to quote multiple statistics one after another. To avoid sounding too repetitive (especially if you’re not presenting them in bullet points), you can consider using words.
However, make sure they’re an accurate reflection of the actual statistic:
- Two out of five (for 40%)
- Three in four (for 75%)
- One-third of (for 33.3%)
If that’s not possible, make sure to word as close to the number as possible and then include the statistic in parenthesis:
- Nearly two-thirds of … (32%)
- Around half of … (49.5%)
- Just under three-quarters of … (73%)
2. Mention the source and link to it
Next, you want to mention the source. And by that, we don’t mean where you first came across the statistic, but its end source.
Going back to our statistic example, say we saw it on this post from Keyword Cupid.
They should not be who you should attribute your statistic to. With a bit of quick Googling, you’ll discover that these guys got the figure from Semrush, which is who you should credit and link to.
With that, this is now what our statistic would look like:
83% of marketers measure organic traffic to evaluate the success of their content. (Semrush)
Note: Misattributions are quite common and it may sometimes take you longer to locate the end source. There may also be cases where the end source is no longer available, in which case you should probably consider looking for a different statistic (and source) for your content.
3. Use the latest statistics and date them
If you stopped me in the streets and asked me where the nearest public restroom was, only for me to point you in the direction of one that closed months ago, the information would be absolute moot.
The same goes for data and content.
When citing statistics in your content, use those that come from fresh data sources.
Continuing with our example, we wouldn’t use the statistic that says that 76% of businesses use organic traffic to measure their content’s success since that’s data from the previous year’s survey.
As a general rule of thumb, data from sources dated the current or previous year can be considered accurate.
However, the extent of what can be considered “fresh” will depend on your topic and industry. For instance, if you’re writing content related to fast-paced industries such as banking and the stock market, data from 2020—or even the past quarter—would certainly be considered outdated.
Don’t forget to date your statistic, which adds a dose of credibility to your content (and by extension, your brand).
That said, this is now what our statistic would look read:
83% of marketers measure organic traffic to evaluate the success of their content. (Semrush, 2021)
You could also go into detail about its methodology and mention details like when and how the survey was conducted.
83% of over 1,500 marketers surveyed in 2020 measure organic traffic to evaluate the success of their content. (Semrush, 2021)
However, depending on how you’re using the statistic in your article and what you’re using it for, this additional detail may not be absolutely necessary.
Three steps to applying statistics in content marketing the right way: 1. Use numbers and not words 2. Mention the source and link to it 3. Use the latest statistics and date themClick To TweetTop external data sources
Now you know why and how you should leverage data in your content, here’s the juicy list of external data sources.
Note that some of these sources are private companies. This means that although some of their reports can be accessed for free, others may require a paid subscription (or a one-time payment).
We’ve sorted these external data sources into the following categories. But some (like eMarketer) do fall into more than one:
- General
- Ecommerce
- Business/entrepreneurship
- Marketing
- Logistics/supply chain
Disclaimer: This is not a sponsored post. These are data sources we use on a regular basis for our clients, and only for the industries our clients are in, which is why we’re able to recommend them with full confidence.
General
- WHO
- World Bank
- US Bureau of Labor Statistics
- US Census
- Statista
- Pew Research Center
- YouGov
- Gartner
- Kantar
- IBISWorld
Ecommerce
Business/entrepreneurship
- US Small Business Administration
- GlobalWebIndex
- University of Michigan (consumer confidence index)
- Appfigures
- Value.today
Marketing
Logistics/supply chain
Three ways to go the extra mile with data in content marketing
The beauty of having access to these external end sources is that they give you LOTS of data to work with.
This means that there’re plenty more things you can use them for in your content marketing strategy.
Here are three ways to go the extra mile when leveraging entire databases:
- Turn those numbers into something visual. With so many statistics at your fingertips, you can create your own visual graphics to represent the data. Not only does this make it easier to consume, but it also presents new opportunities to share the content. Posts with images tend to perform better on social media, so charts and infographics are great to that end. Plus, with so many free visual marketing tools available on the market, there’s really no reason not to do it.
- Make them easy to share. If you’re gonna go visual with your statistic, then you definitely need to make sharing it easy. This is as simple as adding social media sharing buttons to your images, and there are plenty of plugins that you can use for that.
- Update with the latest figures. Google loves fresh content. When incorporating a statistic into your content, browse through previous reports (if any) to see whether you can expect new reports to be released and when.
DataReportal, for instance, releases a global report every three months. Jot this down in your editorial calendar and update your content when there’s a fresh statistic. If you have an accompanying graphic, don’t forget to update that as well!
Want to learn more?
- Blog content development: 7 mistakes to avoid
- How to make SEO-friendly content (with top SEO content examples)
Lin’s an ex-journalist who’s found her new love in content marketing. In her spare time, she’s on a secret conquest to find a solution to never having to cut her nails again.


